Customer Churn Prediction with Machine Learning
An end-to-end pipeline: data preparation, exploratory analysis, modeling, evaluation, and business integration.
Customer churn erodes recurring revenue. This case study demonstrates how we built an interpretable machine-learning workflow to identify at-risk customers early and surface drivers behind churn, enabling proactive retention campaigns.
Dataset
We used a public telecom churn dataset with demographics, account, and service usage information. The target
label is Churn (Yes/No). The data is categorical-heavy (e.g., Contract,
InternetService) with a churn rate of ~25–30%.
- Records: ~7,043 · Features: 21
- Split: 80/20 train–test with stratification
- Imbalance handled via class weights / thresholding
Data Preparation
- Standardized binary fields (
Yes/No→ 1/0), coerced numeric types (e.g.,TotalCharges). - One-hot encoding for multi-class categoricals (
Contract,InternetService). - Scaled numeric features (
tenure,MonthlyCharges). - Stratified split to preserve churn ratio across train–test.
# Sketch of preprocessing
num_cols = ["tenure", "MonthlyCharges", "TotalCharges"]
cat_cols = ["Contract", "InternetService", "PaymentMethod", "PaperlessBilling"]
# impute/scale numerics, one-hot encode categoricals
preprocess = ColumnTransformer(
transformers=[
("num", Pipeline([("imputer", SimpleImputer()), ("scaler", StandardScaler())]), num_cols),
("cat", OneHotEncoder(handle_unknown="ignore"), cat_cols)
]
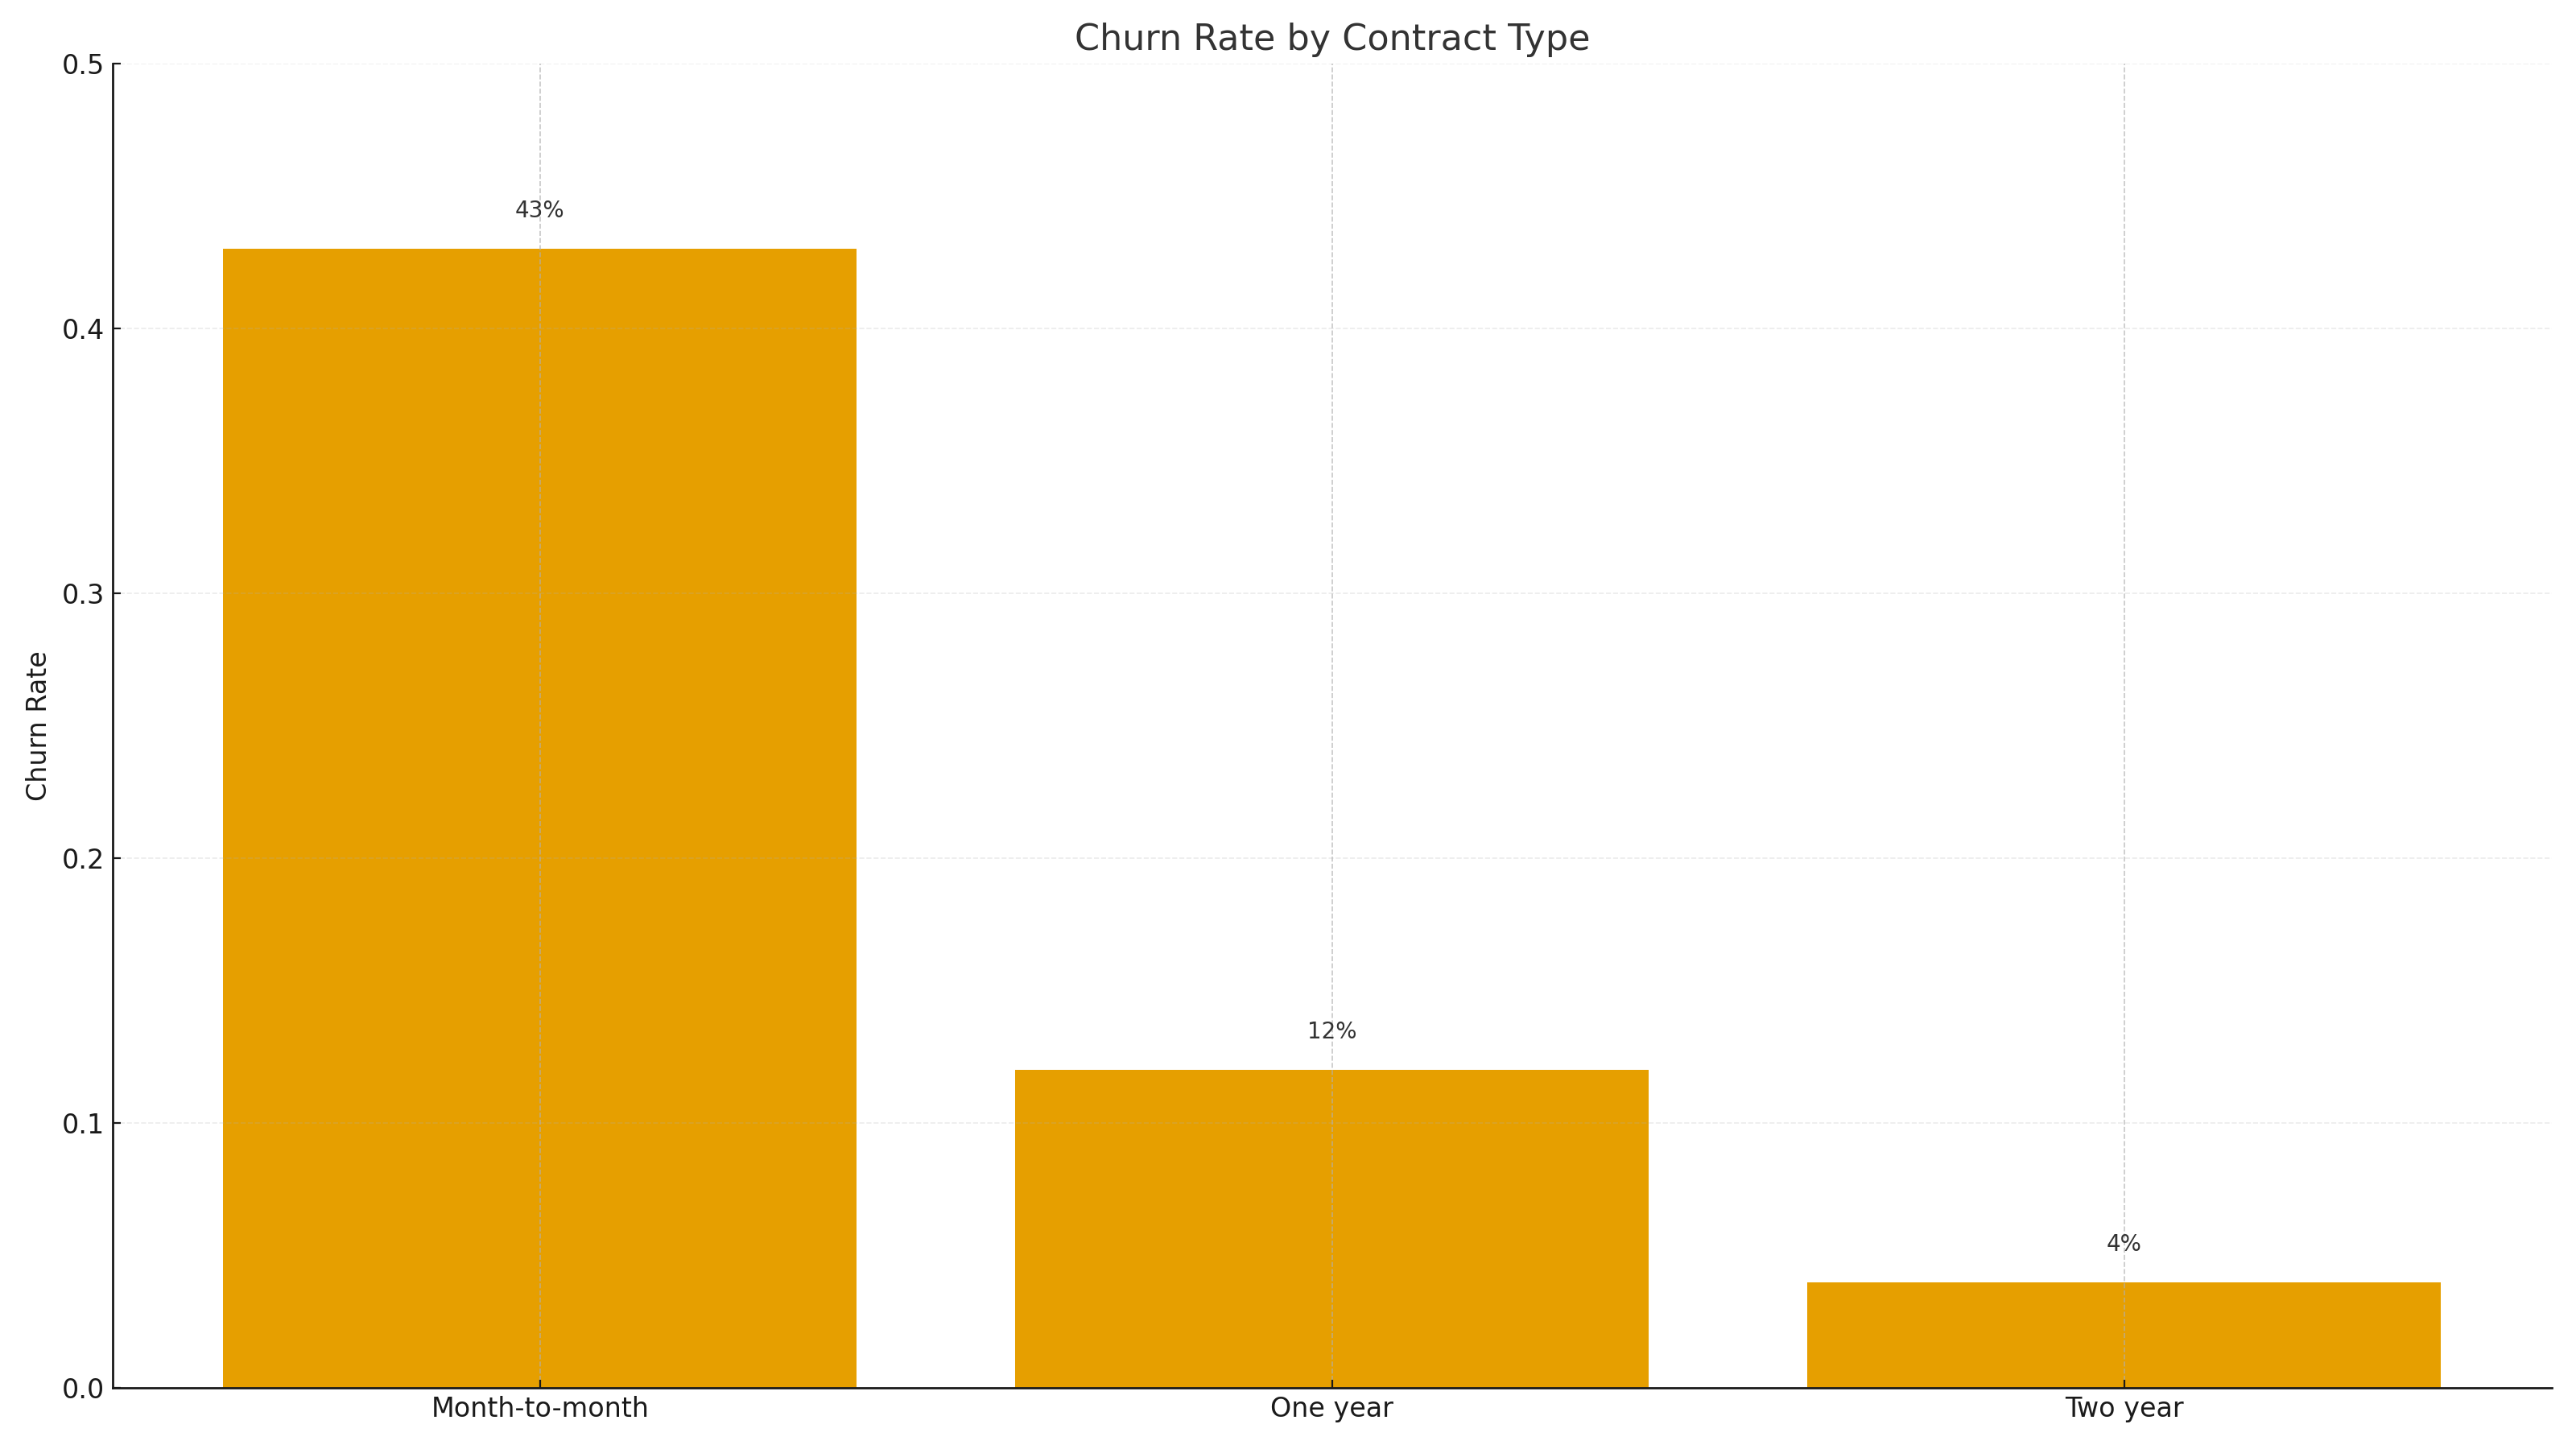
)Exploratory Analysis (EDA)
We observed higher churn among month-to-month contracts and low-tenure customers. Increased
MonthlyCharges slightly raised churn propensity. Paperless billing showed notable patterns.
Modeling
We compared baseline and tree-based models, then tuned XGBoost:
- Baselines: Logistic Regression, Random Forest
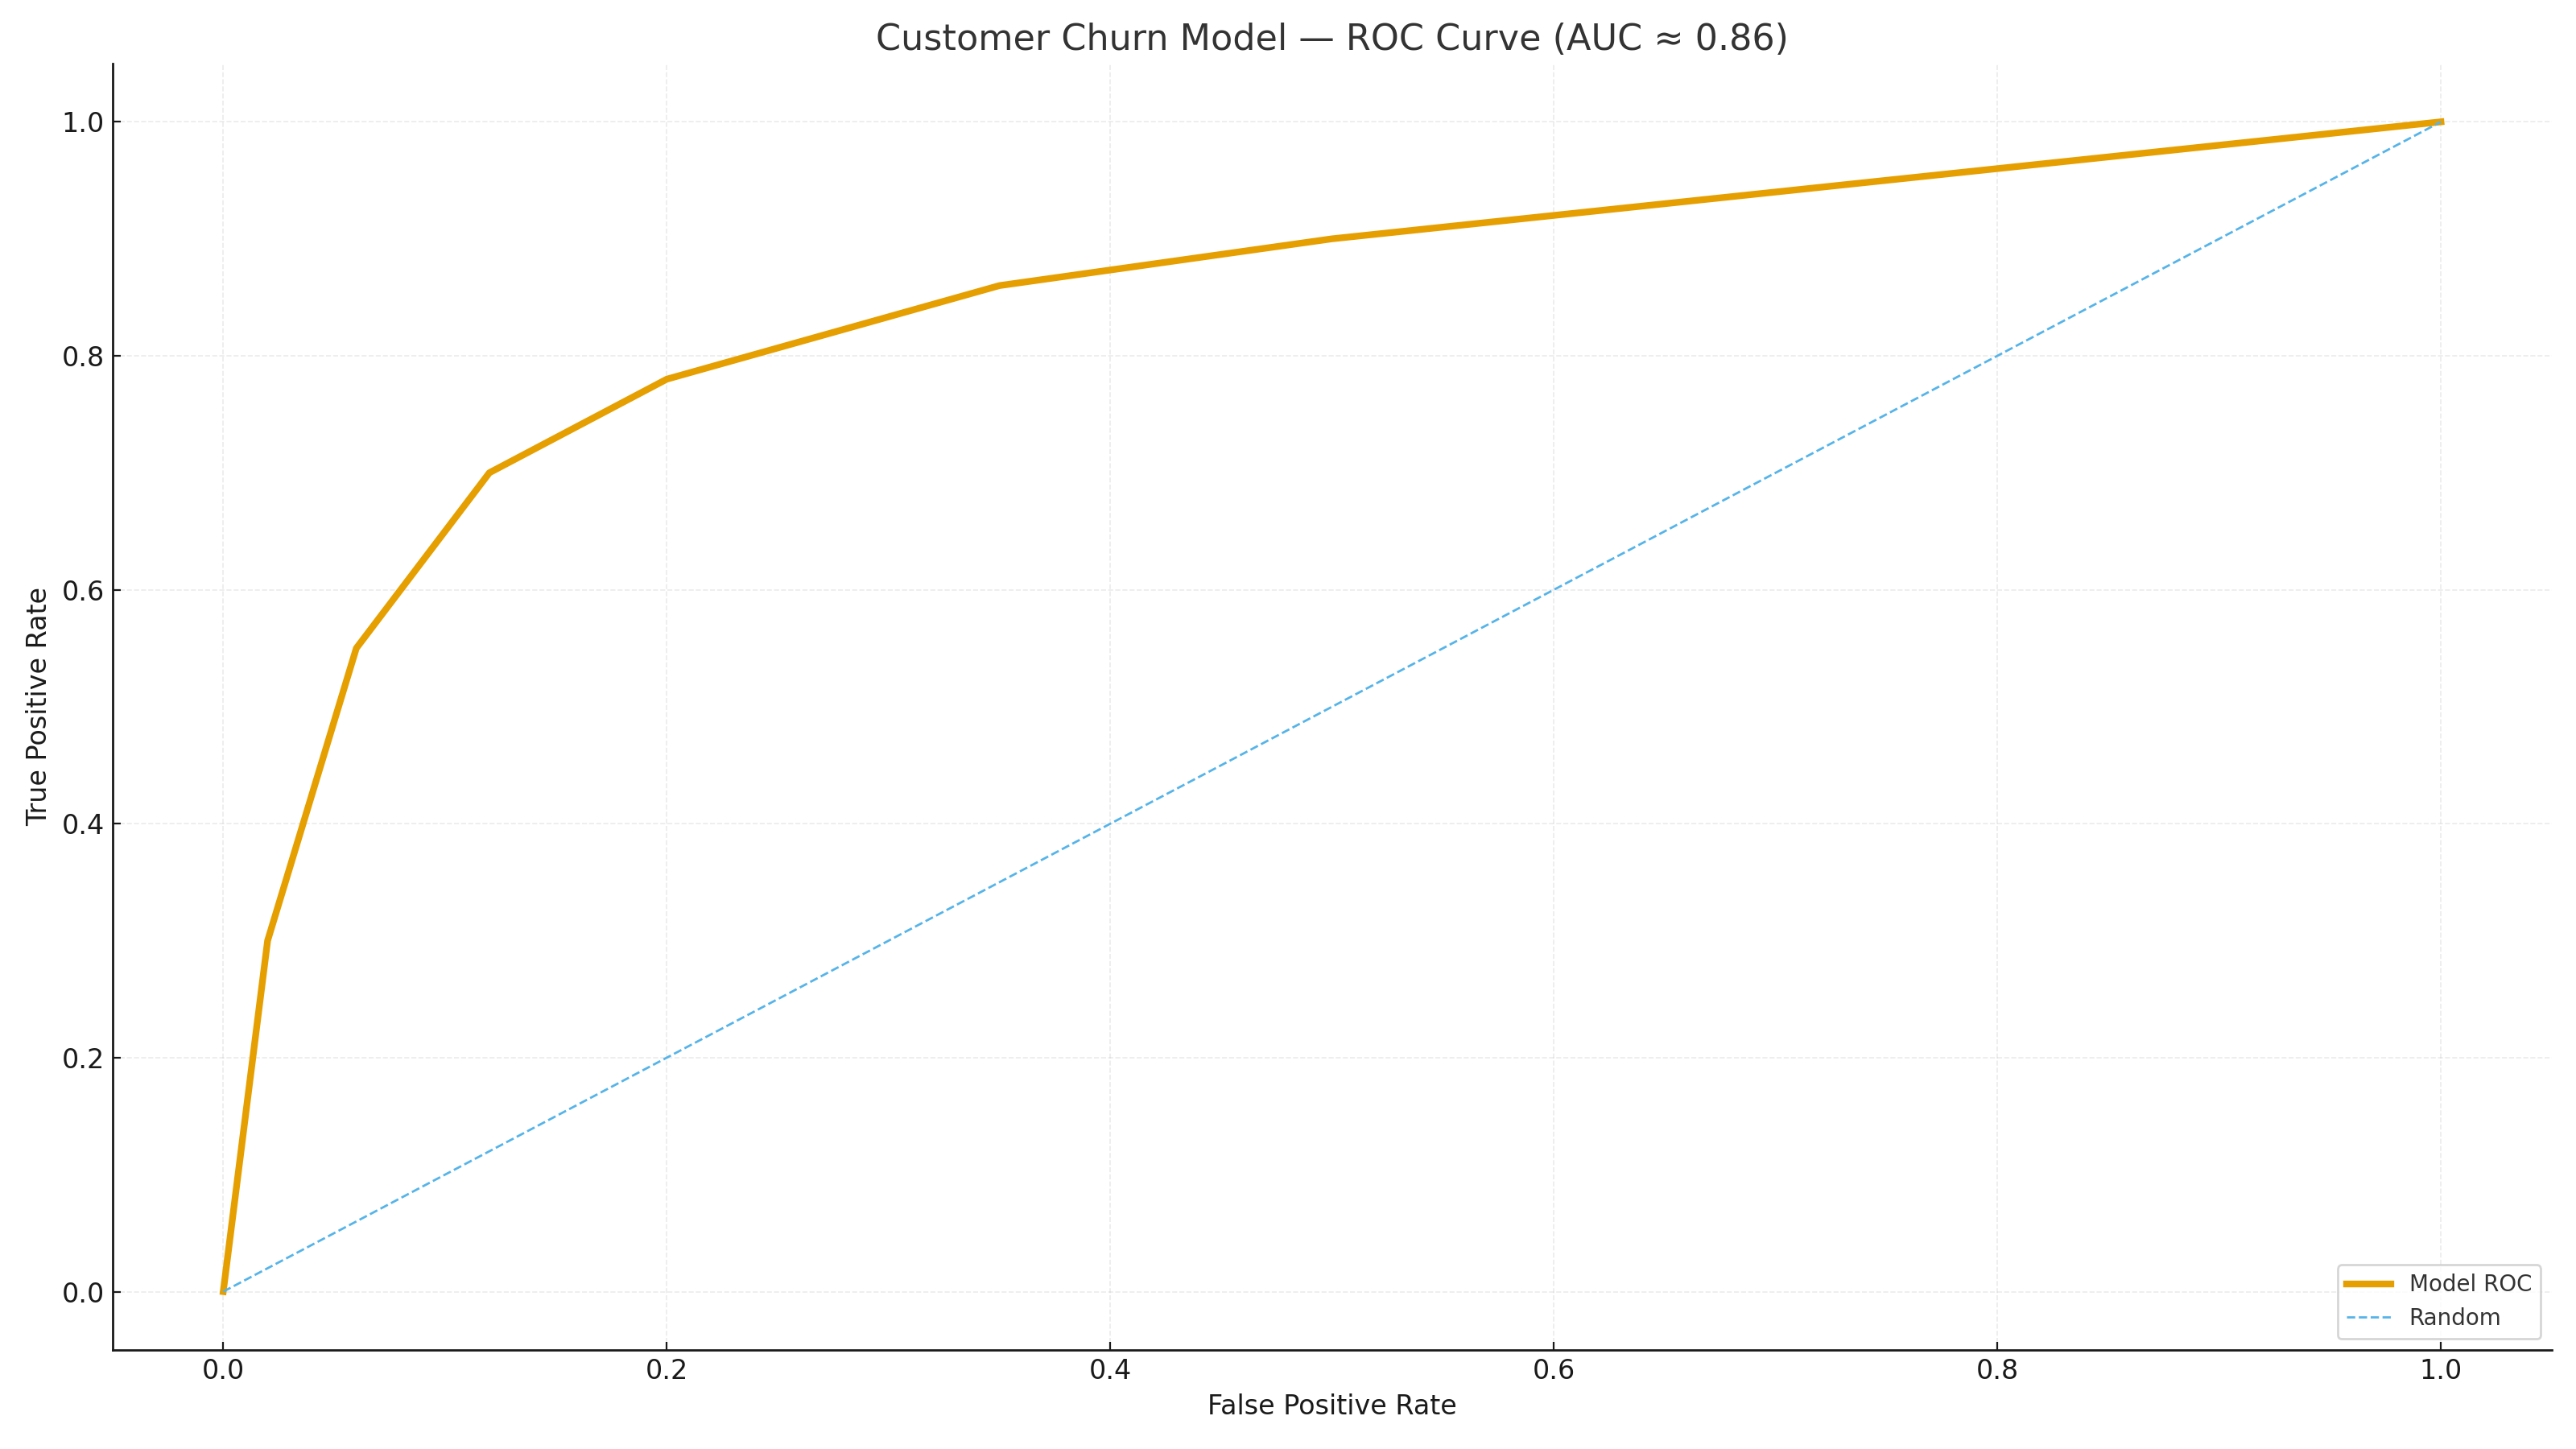
- Best: XGBoost with class weighting & hyperparameter search (depth, estimators, learning rate)
- Metrics: Accuracy, Precision/Recall/F1, ROC-AUC; business goal prioritized recall
# Sketch of pipeline & tuning
model = XGBClassifier(eval_metric="logloss", scale_pos_weight=pos_weight)
clf = Pipeline([("prep", preprocess), ("model", model)])
params = {
"model__n_estimators": [200, 400],
"model__max_depth": [4, 6],
"model__learning_rate": [0.05, 0.1]
}
grid = GridSearchCV(clf, param_grid=params, scoring="roc_auc", cv=5, n_jobs=-1)
grid.fit(X_train, y_train)
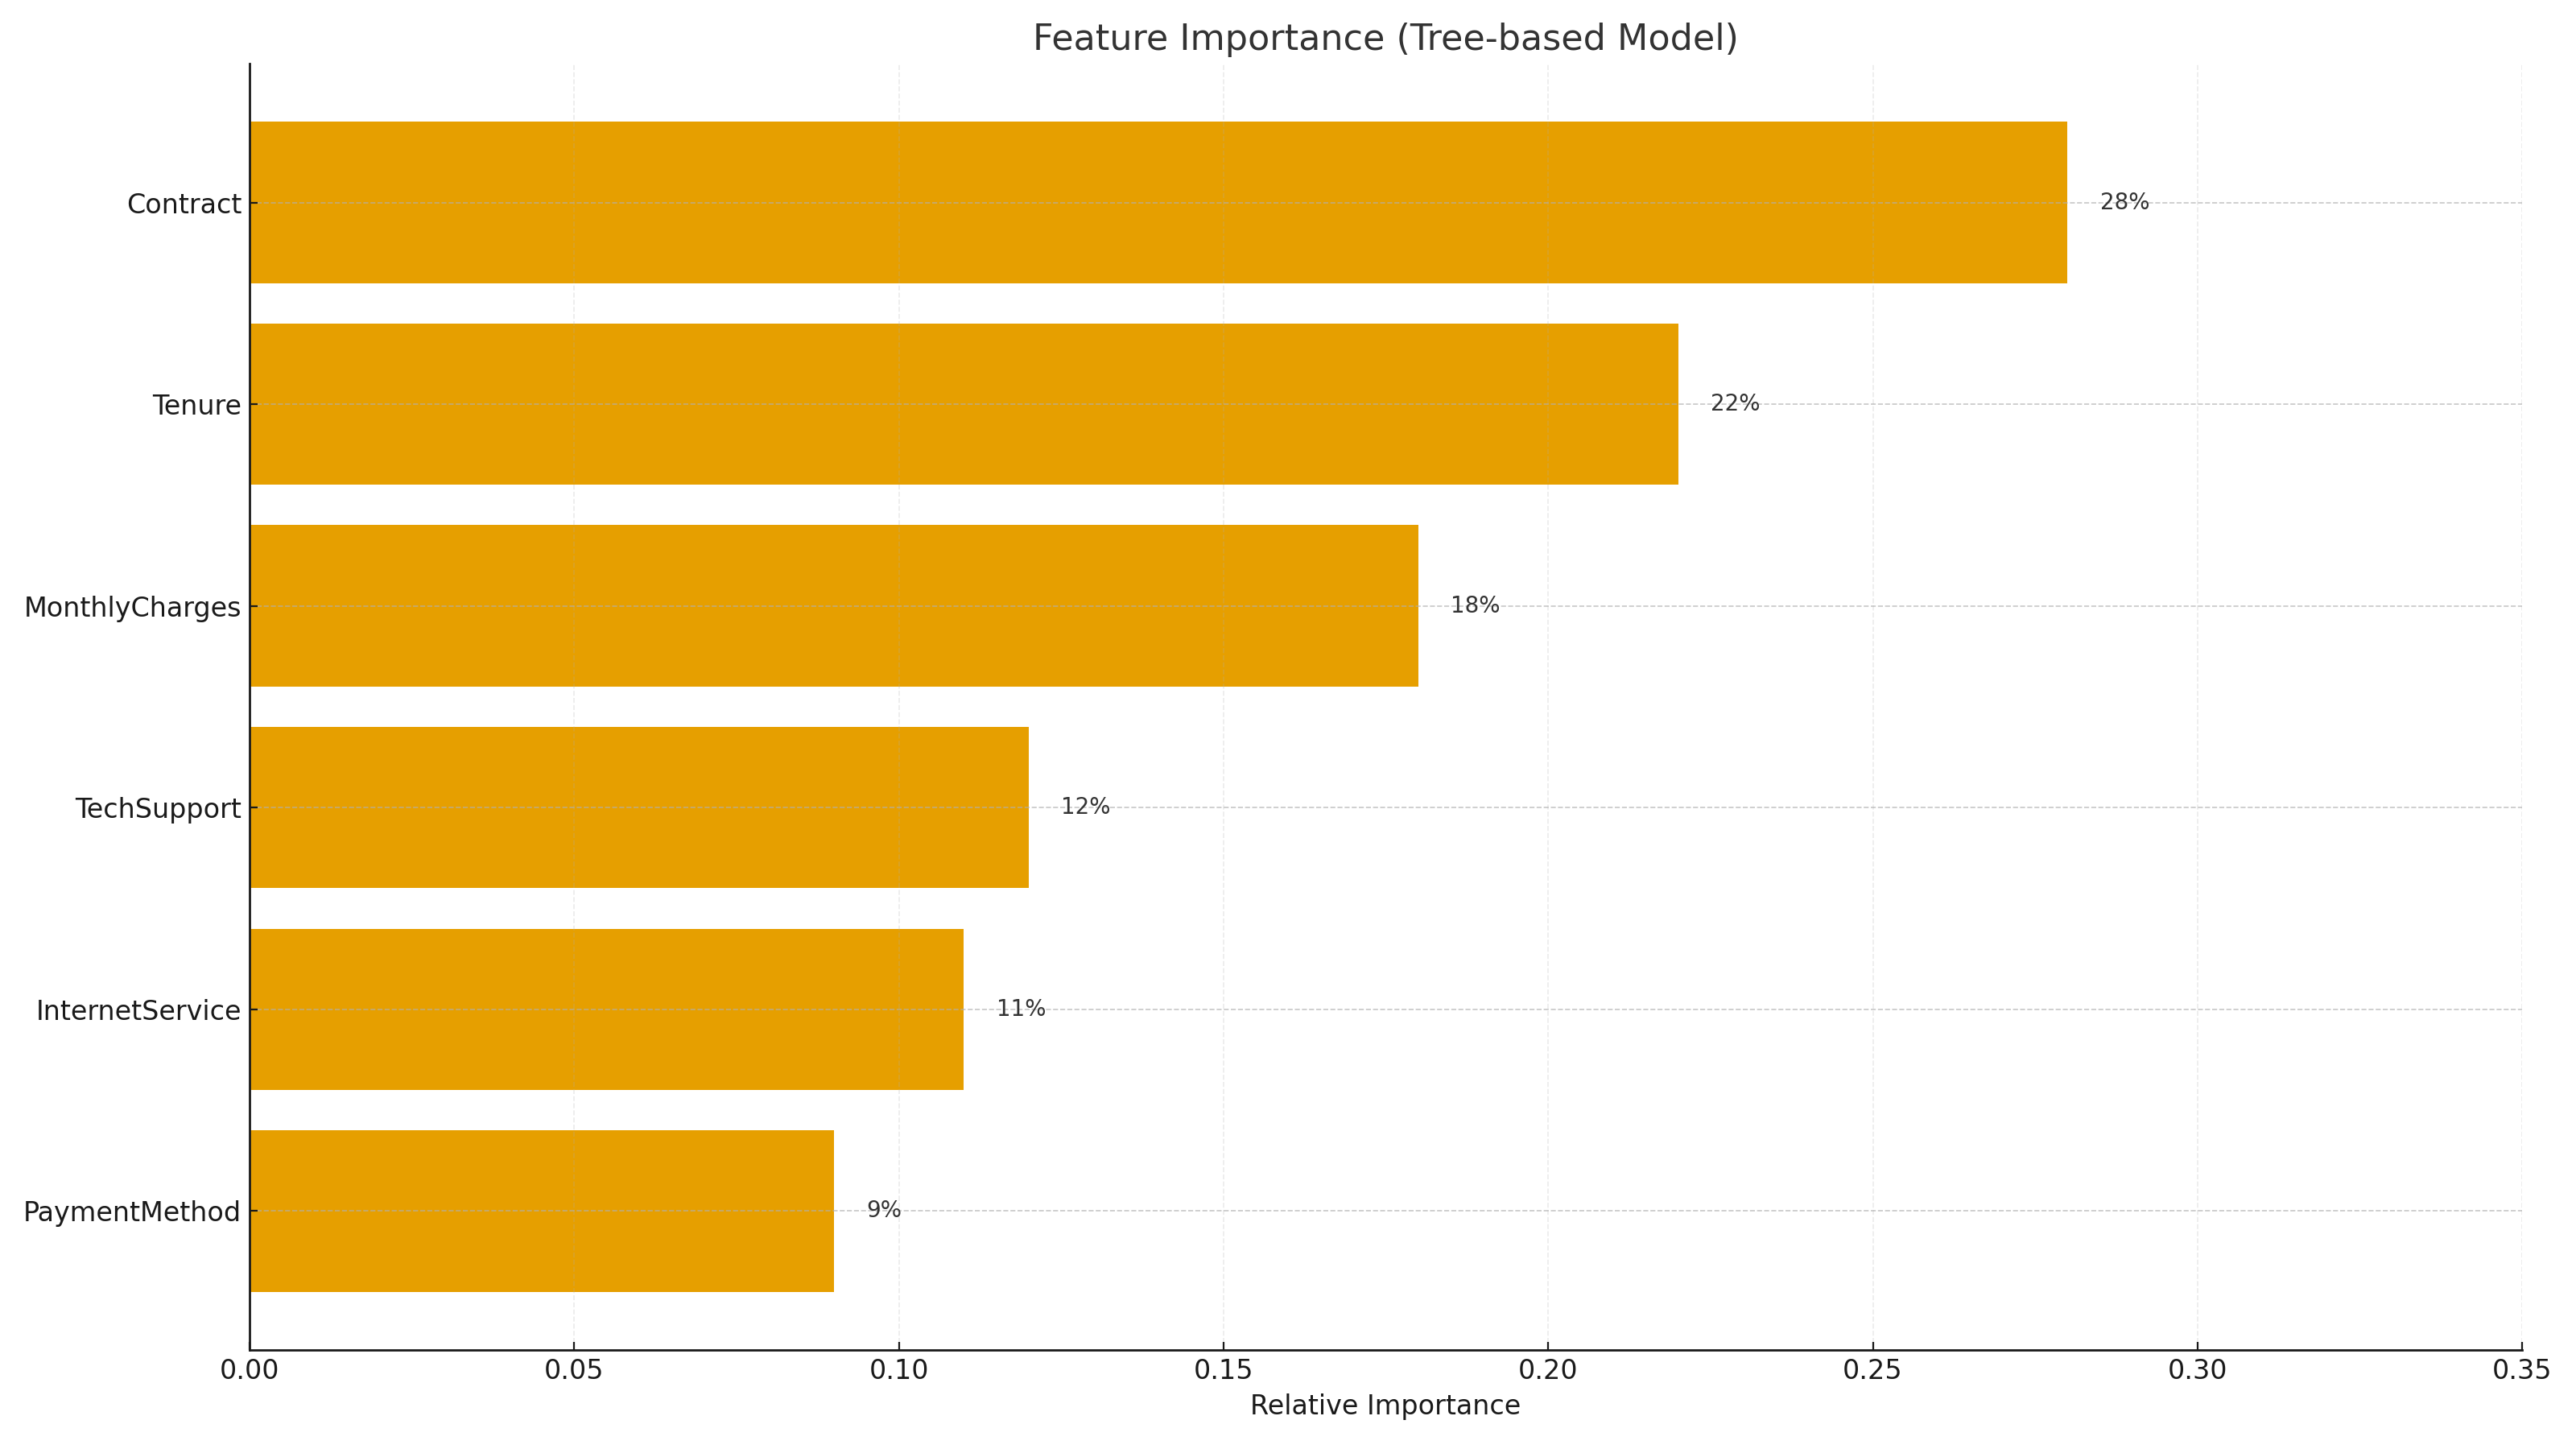
best = grid.best_estimator_Evaluation
Threshold selection favored recall to reduce missed churners. Feature importance highlighted Contract, Tenure, and MonthlyCharges as key drivers. SHAP can be added for instance-level explanations.
Scoring Output
We produce a BI/CRM-ready table with probabilities, risk bands, and top factors, enabling targeted retention:
CustomerID, ChurnProbability, RiskBand, TopFactors
7590-VHVEG, 0.81, High, Contract:Month-to-month; Tenure:Low; MonthlyCharges:High
5575-GNVDE, 0.65, Medium, Contract:Month-to-month; PaperlessBilling:Yes
3668-QPYBK, 0.22, Low, Contract:One year; Tenure:High
Tech Stack
Python · Pandas · Scikit-learn · XGBoost · Matplotlib · (Optional) SHAP · Power BI (consumption)
Next Steps
- Deploy as a lightweight API for real-time scoring.
- Schedule monthly retraining & drift monitoring.
- Integrate with CRM to automate retention workflows.